A geographical approach to finding the world’s most demanding driving environment.
by Doctor Adrian Luckman, School of the Environment and Society, Swansea University
Contents:
- Introduction to the task
- A hierarchical approach to finding candidate sites
- The Geography of Flat Places
- Sources of data in the search
- Geographic data analysis
- Topographic and land cover data analysis
- Refinement using Google Earth and other satellite data
- About the author
Land speed records have always had high demands for a suitable test site. The driving environment must meet stringent specifications of smoothness and space. The history of land-speed records has demonstrated that some types of dry desert lake beds can provide a suitable running surface and Black Rock Desert in Nevada, USA provided the successful environment for Thrust SSC to reach over 760 mph in October 1997.
Although the record is measured over a single mile or kilometre, the colossal speeds to which the car must accelerate, and from which it must then be slowed down, make the required length of surface many times that distance, and longer with every new record attempt. BLOODHOUND SSC aims to reach a speed of over 1000 mph and the total distance travelled during each attempt at this speed will be more than 10 miles. To allow an adequate safety margin, both in length, and width to allow for some lateral drift, a suitably smooth test site must measure at least 12 miles by 3 miles. Unfortunately, as the Black Rock Desert has deteriorated over the past decade, a new test site needs to be found.
Here we document a unique approach to searching for the world’s most demanding driving environment: a test site for the BLOODHOUND Project. The aim of this study was to find new physically suitable candidate test sites by taking a semi-automated computer-based geo-scientific approach. We make use of the recent profusion of global geo-spatial digital datasets and readily available computing power. The result is an objective and exhaustive list of possibilities from which candidate sites may then be chosen.
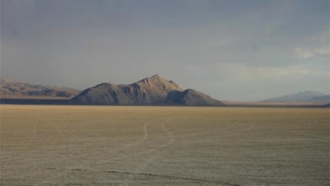 Black Rock Desert (left): No longer suitable as a test site for BLOODHOUND SSC, but an example of what we are looking for (Source: Wikipedia)
A hierarchical approach to finding candidate sites
Equally important to finding a suitable test site for BLOODHOUND SSC, is making sure that no potential test sites around the world are overlooked. It was decided that a hierarchical approach would be adopted which should first seek sites based on their physical suitability, and only then to use secondary selection criteria such as physical access, infrastructure and national sensitivities. The search should prioritise being objective over being subjective, use automated computer methods before applying human decision making, and look globally before refining locally. This was expected to be the most likely method to result in a globally exhaustive list of potential sites. A hierarchy of priorities was proposed for such an approach:
1. Flat ground (insignificant surface slopes)
2. Smooth surface (at the level of centimeters)
3. Large area (12 miles by 3 miles minimum)
4. Reliable surface dry-out period (may be different time of year for different climate regimes)
5. Access from road network (with heavy loads)
6. Security (political and non-political)
7. Friendliness of local government
8. Potential for publicity and constructive competition
This study deals with the early parts of the priority list to which geo-spatial analysis may be applied.
The reason that dry lake beds such as Bonneville salt flats in the USA, Lake Eyre in Australia and the Black Rock Desert in the USA feature so prominently in the history of land speed record attempts is that they combine adequate size with suitable surface characteristics including hardness and smoothness. The smoothness results from the geography and hydrology of the regions which provides closed basins in which endorheic and playa lakes can form. In these lakes, the inflow from rivers and/or precipitation is roughly balanced by evaporation and seepage into the substrate, rather than the more usual outflow via rivers to the ocean. Suspended sediment entering the lakes settles out slowly and evenly to form a very flat and level lake bed, and during the dry season some of these lakes evaporate completely to leave a smooth surface to dry and harden in the sun. These types of lakes are often saline and the lake beds can be vary from hard salt crystals to softer fine sediments.
Through geographical, geological and meteorological considerations, regions favouring the formation of endorheic and playa lakes in general can be predicted. However, there exists no complete record of the very large number of such lakes that exist around the world. It is highly likely that the most suitable test sites for the Bloodhound land speed record will be of this nature. By seeking the characteristics of flatness and size, endorheic lake beds may be automatically found and some will undoubtedly prove suitable.
The primary criteria of size and surface smoothness demand data which can describe such topographic and geographic characteristics for the whole land surface of the globe, apart from clearly inhospitable regions such as the Arctic and Antarctic. Unfortunately, no such data exists which describes the land surface to the centimeter level of smoothness. However, there does exist a near-global dataset which describes land surface topography at high spatial resolution. We can make the assumption that large, flat areas detected in this dataset are likely to be lakes or lake beds and that the nature of such surfaces make them potentially smooth enough for further inspection.
The source of near-global topographic data is the Shuttle Radar Topography Mission (SRTM). SRTM employed a technique called satellite radar interferometry, using data acquired by the Space Shuttle in February 2000, to build a digital elevation model (DEM) of the land surface between the latitudes of 60° North and 56° South. This data has been made freely available at a spatial resolution of approximately 90 m and forms one of the main sources of data for this study.
To discriminate between seasonally dry lake beds and areas that may once have been so, but now no longer flood periodically, land cover characteristics can reveal the presence or absence of vegetation. Because they are important in climate and land surface modelling, several global datasets are available which have used satellite imagery to classify land cover into a number of types. These include the Global Land Cover Facility and the Global Land Cover project 2000. These data were acquired at a spatial resolution of 1 km to aid the search for a suitable test site.
Data sources used for the final stages refinement of test site location included Google Earth, Google maps and high spatial resolution satellite data from the NASA Landsat series. For further visualization, NASA Blue Marble satellite composites were also used.
The Earth is spherical and its surface is curved, yet we humans like to have data presented to us as if the Earth were flat, using paper maps or plane computer screens. Thus any global study must manage the process of mapping the Earth’s surface from its three-dimensional spherical nature into two dimensions. Anyone who has tried to wrap up a Terry’s Chocolate Orange for Christmas knows that there is no simple solution to laying something flat directly against the entire surface of a sphere without some wrinkles or distortion. The process of finding a mapping between the Earth’s surface and a plane representation of it is know as map projection. Map projections and the handling of digital geographic data is often achieved within what is known as a Geographical Information System or GIS. GIS consists of a linked system of geographic database and computer processing tools to store, manipulate and visualize that data. Phase 1 of the desert selection involved the development of GIS database and processing tools.
The search for a test site for BLOODHOUND is almost global, missing only the high northern and southern latitudes which, through reasons of climate, don’t produce the kind of dry lake bed we are looking for. The search process also requires a minimum of distortion between features on the Earth’s surface and those represented within the GIS. The solution adopted was one of multiple mapped areas to cover the globe, based upon a common map projection known as Universal Transverse Mercator (UTM). UTM is designed for mapping areas of low to medium latitude with minimal distortion and allows the Earth’s surface to be represented by a coordinate system measured in meters.
Using the UTM map projection, the relevant part of the global land surface was divided into seven map sheets covering Africa, Australia, Central-Asia, East-Asia, Europe, North America, and South America. Strictly speaking UTM is not designed for such large areas but we were able to accept the distortion inherent in this choice. Figure 1 shows the mapping between geographical areas and global coverage, while Figure 2 gives an example map in the UTM map projection.
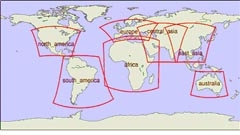
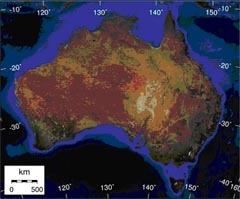 Figure 1 (left): Selected map areas for topographic analysis
Figure 2 (right): NASA Blue Marble composite satellite data to illustrate the Australia map area in the UTM map projection.
Topographic and land cover data analysis
The aim of the automated part of the site selection process was to locate large flat areas of the global land surface using an analysis of topographic elevation data represented by the STRM DEM and to refine the list of possible targets by rejecting those which global satellite land cover analysis show to be covered in vegetation. The procedure chosen to achieve this aim was one of calculating topographic variance (http://en.wikipedia.org/wiki/Variance), or a simple mathematical representation of the total variability in surface height within a given area. Regions with high topographic variance may be rejected as being too rough, while areas exhibiting very low topographic variance over a number of adjoining pixels are likely to be lake beds or similar land surface features.
It was necessary to construct a DEM at a spatial resolution of 100 m from the SRTM data by geographically projecting the original data onto the seven chosen UTM map areas. All in one go, this process would have created files too large to handle efficiently on a normal computer system, so it was managed by dividing each map area into a number of overlapping tiles. These tiles were 11,000 km by 11,000 km in size, had an overlap of 1000 km and, for example, Australia was covered by 20 such DEM tiles, each requiring 46 Mbytes of disk space. The overlap was necessary to make sure that calculations of topographic variance were not limited by boundary effects near the edges of tiles. Figure 3 shows in shaded relief an example of the complete DEM for the Australia map area.
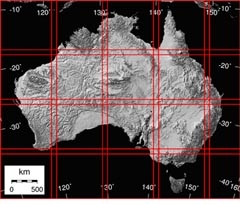 Figure 3 (right): Shade relief representation of the complete Digital Elevation Model of Australia divided into 20 map tiles (red lines) of 11,000 km by 11,000 km with an overlap of 100 km and constructed originally at a spatial resolution of 100 m.
Within each tile of each geographic map area, the variance was measured in 10 km by 10 km DEM patches. This represents the approximate scale of the required smooth surface on which BLOODHOUND SSC is to run. The algorithm essentially took all the DEM height values within the 10 km square patches (100 by 100 DEM samples) and calculated the variance in topographic height. The patch variance was sampled on a grid of 1 km; that is the centres of the patches were spaced at 1 km intervals to produce a map of topographic variance with a nominal spatial resolution of 1 km (recognising that neighbouring samples are not truly independent of one another). Thus, in the output maps, areas of 20 or more adjoining 1 km pixels with low variance indicate regions both large enough (20 km ~= 12 miles) and flat enough to be investigated as potential lake bed sites.
To further refine the selection process, the two sources of land cover data were also reprojected into the same map projection at the output spatial resolution of 1 km. Figure 4 shows one of the datasets used.
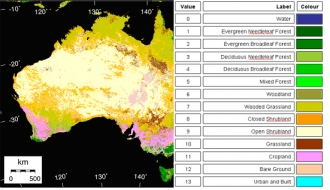 Figure 4 (left): Land cover map for the Australia map area reprojected from data from the Global Land Cover Facility. Click on map for more detail.
Areas with land cover classes of ‘bare’, ‘short vegetation’ (to allow for the possibility of mis-classifications) and ‘water’ (to pick up seasonally-flooded lakes) were included and all other classes were excluded as being unsuitable.
The result of the combined topographic variance and land cover analysis was a series of maps for the seven geographical regions presented at a spatial pixel size of 1 km by 1 km and highlighting large (> 10 km) areas of low topographic variance (< 10) with minimal vegetation cover.
The Atlas of flatness
An example of the resulting map of BLOODHOUND test site potential is shown in Figure 5. Maps for the remaining 6 regions can also be viewed.
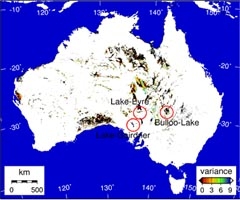 Figure 5: Potential BLOODHOUND driving environments of Australia highlighted by combining low topographic variance with suitable land cover classes. Blue is water; white unsuitable due to terrain or land cover; elsewhere colour bar indicates level of flatness. Two previous land speed record test sites identified by the process are marked, along with a example of a third (Bulloo lake) prompting further investigation.
Refinement using Google Earth and other satellite data
The maps of global site suitability for BLOODHOUND represent the point in the desert search program at which the objective, computer-based work ends and the human hands-on approach can begin to bring higher spatial resolution data, previous experience and other factors to bear. The combination of low topographic variance and suitable land cover provides an exhaustive list of possible sites from which to choose a smaller number of candidates for consideration.
The first stage in the refinement process was to use Google Earth to inspect each point at which 20 or more low variance pixels of 1 km (~12 miles in all) were bunched together. Google Earth was chosen because it provided ready access to aerial imagery of sufficient spatial resolution to identify the extent of lake beds, and to allow obstacles such as roads to be spotted. It was discovered that Google Maps occasionally included different aerial imagery to Google Earth so this was used in conjunction to gain a second view of each target on a separate date, and therefore at a potentially different part of the seasonal cycle.
Following an exhaustive day of matching low variance targets to Google Earth imagery around the globe, a list of 36 possible BLOODHOUND test sites was produced, nine of which were previous sites for land speed record attempts. These sites are illustrated in Figure 6. Further prioritization resulted in a list of 13 sites requiring further investigation.
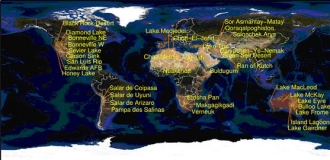 Figure 6: Locations of 36 test sites identified by the topographic variance technique as worthy of further consideration. Background map “Blue Marble”, NASA. Click for more detail.
An important characteristic of potential lake bed test sites for BLOODHOUND is that they flood periodically and therefore maintain the smooth surface on which to run the hard wheels. No one aerial image will capture the periodic nature of seasonal flooding so it became clear that as many images as possible were desirable to help assess suitability. In addition to the Google Earth and Google Maps data, therefore, for the 13 investigation sites, Landsat data was also investigated. Maps depicting the spatial coordinates and scale of each potential site were constructed, an example of which is shown in Figure 7.
Another factor in choosing a test site, and deciding when is the most appropriate time to make a site visit is the local climate. Mean climate data were accessed from the BBC web pages to give an idea of when the dry season occurred for the sites investigated further. An example for is shown in Figure 8.
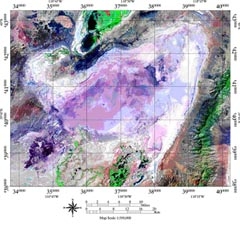
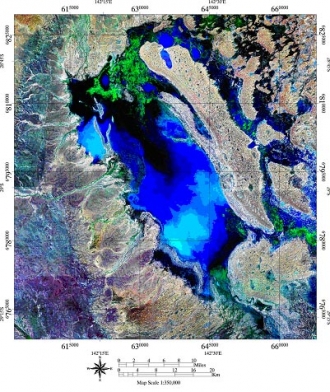 Figure 7: Carlson Sink, USA (left) and Bulloo Lake, Australia (right): examples of maps produced from NASA Landsat imagery to further investigate potential test sites located by the variance and Google Earth analysis
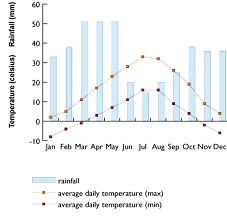 Figure 8: Average monthly temperature and rainfall for Salt Lake city, the city closest to the Utah and Nevada sites.
Adrian Luckman is Reader in Geography at the School of the Environment and Society, Swansea University, UK . He specializes in satellite remote sensing for glaciological applications and uses computer geo-spatial programming to deal with topographic and geospatial data. The School of the Environment and Society teaches degree scheme at undergraduate level in Physical Geography and Geo-Informatics, including Satellite Remote Sensing and GIS, and at masters level in Environmental Dynamics and Climate Change .
Go back to Desert Selection - phase 1
Go on to Desert Selection - phase 2
Swansea University
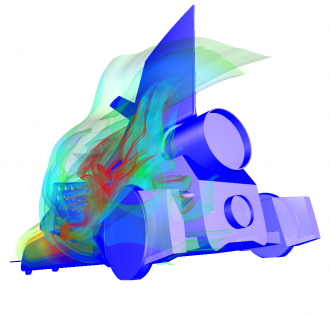
Swansea University is proud to be part of the BLOODHOUND team. Our work on computer fluid dynamics (CFD) is at the heart of research on the design and aerodynamics of the 1,000mph Car.
Swansea University is a world-class research-led dual campus university. Its main base, Singleton Park Campus, is located on a beautiful 47 acre parkland estate and its £450 million Bay Campus, which opened to students in September 2015, is based on the beach on the eastern side of Swansea city centre.
The University was established in 1920 and currently offers around 350 undergraduate courses and 100 post-graduate courses to over 19,000 undergraduate and postgraduate students.
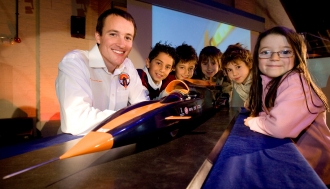 Ben Evans showcases a model of the BLOODHOUND SSC to school children at the launch in 2008 at the National Waterfront Museum
Swansea University continues to maintain its position as one of the top universities in the UK for engineering. The College of Engineering is now based at Swansea University’s Bay Campus , which has four buildings dedicated to engineering, holding 30,000m2 of laboratory and office space and over £10 million of new research and teaching equipment.
The College of Engineering is ranked within the Top 10* in the UK and is internationally recognised for its cutting-edge research with 94% of research produced by academic staff rated World-Leading or Internationally Excellent quality** .
The College has strong and establish links with a large variety of local, national and international companies both with its teaching and research. It has significantly contributed to a number of prestigious projects from the aerodynamics design of the THRUST Supersonic Car, which currently holds the World Land Speed Record, to BLOODHOUND.
The computer fluid dynamics (CFD) research for BLOODHOUND is being undertaken at the Zienkiewicz Centre for Computational Engineering (ZCCE) one of four research centres with the College.
To find out more about the College of Engineering please go to our website www.swansea.ac.uk/engineering or follow us on Facebook, Twitter or Instagram .
* The Times & Sunday Times University Guide 2016
** Research Excellent Framework 2014